
UK average house prices increased by 7.8% over the year to June 2022, down from 12.8% in May 2022. However, as any successful property or land developer will tell you - the local picture is just as important as the national one. As a developer, it’s important for you to be able to leverage property data to find which areas in the UK are performing well when choosing a site.
Introduing the residential Value Growth Overlay
Our new Residential Value Growth overlay accurately displays the growth rate, as a percentage, of average residential sales values when comparing the last 12 months with the 12 months prior.
Without Nimbus, this information is usually gathered from looking at house price indexes, however, these are usually provided on a regional basis and therefore may not be accurate for a specific area of town.
The new Nimbus overlay aggregates growth rates on a neighbourhood basis showing how that neighbourhood has performed and which areas are performing well versus those that are performing badly, helping you choose the best site to support your goals.
How the Residential Value Growth Overlay will help you
Finding prospective residential developments can be a time-consuming task, especially when researching valuations across regions.
As a developer, you can easily leverage this data using our overlay to find which areas in the UK are performing well, versus those that are performing badly - to support your property strategy and perform the relevant due diligence on an opportunity and have comfort that the sales price in your approval will help you.
Note - Did you know you can now also request a full Local Search through our Client Solutions service, which covers radon risk together with a number of other hazards such as contaminated land, ground stability, air quality, etc? Find out more.
How to use the overlay
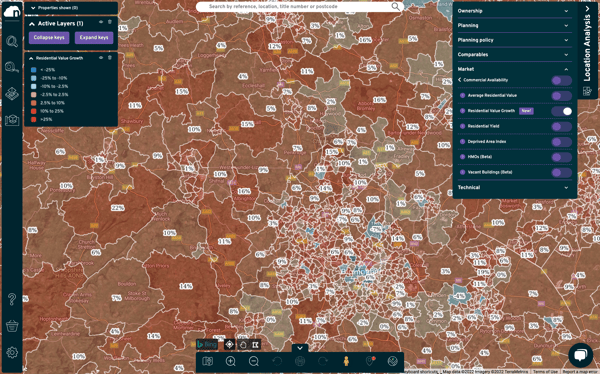
Simply select the Location Analysis tool in the top right of the Nimbus Maps app, then select the Residential Value Growth overlay from the Market dropdown menu.
The map highlights areas of higher and lower residential growth, based on the key in the top left corner.
Want to learn more about how Nimbus Maps will help you assess potential land and property opportunities? Book a personalised demo or request a free trial today.

