Features and Overlays Explained
To empower property professionals with the resources they need to succeed in today's competitive property market our platform provides a comprehensive suite of innovative tools and features, including advanced planning, market analysis, and technical tools.
Planning Applications
Nimbus provides a comprehensive solution for property developers and investors to evaluate investment opportunities. This specific innovative tool allows users to access planning applications overlaid on a map in their desired area, providing all relevant information such as:
- Application Type (Residential, Commercial, Both/ Conversion)
- Application Size
- Application Age
The data is colour-coded and pinpointed to provide a visual assessment of planning density and the likelihood of approval for new applications. The planning application feature is dynamic and user-friendly, offering the ability to display individual planning applications by reference number and status, and to link directly to the local authority's website for more details.
Overall, it is an essential tool for property developers and investors looking to evaluate investment opportunities, assess planning density, and make informed decisions.
Council Boundaries
It is essential for property developers and investors to know council boundaries in the UK because each council has different planning policies, regulations, and priorities. These policies and regulations can greatly impact the development process and the likelihood of obtaining planning permission for a property.
Nimbus shows precise local authority jurisdiction borders so users can tailor their development plans and strategies to fit within the specific policies and regulations of the council in which the property is located. This can increase the chances of obtaining planning permission, identify potential opportunities and risks within specific areas, and help avoid costly delays and rejections.
Nimbus also provides the full contact details including email, website and link to the local plan. This information can be used to help you connect quicker with a specific council, make informed investment decisions and ultimately maximise returns on investment.
Brownfield Land Register
Brownfield sites are important for property developers in the UK as they can offer cost-effective opportunities in desirable locations, provide environmental benefits, and support regeneration and economic growth.
Nimbus helps developers identify potential development opportunities and access information about the suitability of specific sites ripe for development. This can save time and resources, and help developers prioritise their efforts and investments.
SHLAA Sites
Accessing SHLAA information helps developers to identify which sites have the potential for residential development. With our innovative overlay, residential property developers can quickly locate areas that have been earmarked as part of SHLAA. This enables them to efficiently evaluate the sites before moving forward.
Typically, these sites will have been assessed to identify the most viable options for development, making them more likely to receive planning permission. The identification of SHLAA sites also suggests that the landowner is open to the potential of selling the property.
What would typically require days of research and sifting through irrelevant information can now be accomplished in seconds, thanks to our comprehensive project pipeline within Nimbus. More information on our SHLAA overlay and how developers can leverage this feature can be found here.
Housing Delivery Test
Each year, the Government issues a report displaying the proportion of homes constructed in comparison to the number of homes required, along with the local authorities accountable for fulfilling these objectives.
If you're seeking information on demand in particular regions, the report is a comprehensive resource. Additionally, similar to the councils' overlay, Nimbus applies a colour code to each local authority region based on their progress in achieving their housing delivery goals.
This is particularly advantageous for individuals interested in investing in areas where there is a high demand for new residential housing and where the councils would appreciate their contribution.
In short, the Housing Delivery Test overlay within Nimbus serves as a link between developers and local authorities to help address the housing crisis.
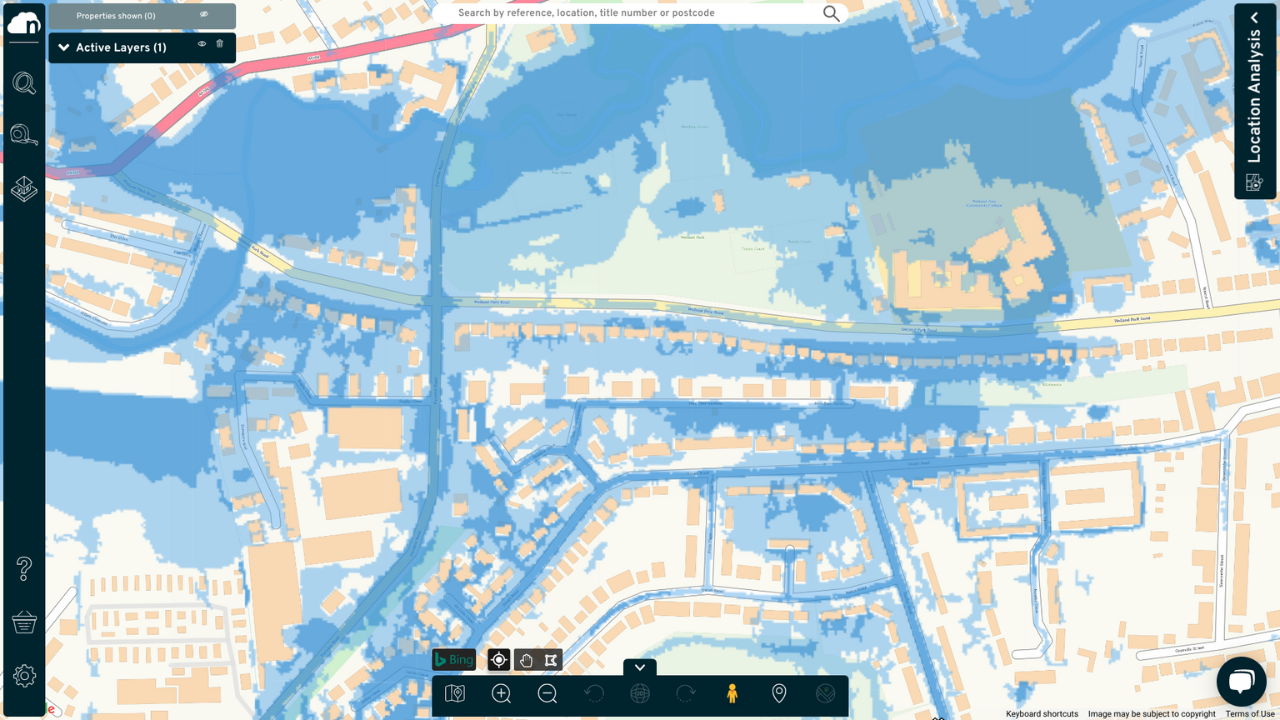
Flood Map
It's essential to have a thorough understanding of potential flood risks when assessing potential sites for new developments. Not only does this help determine the sustainability of the development in relation to flood risk, but it also helps you understand the potential impact your development may have on the environment and the increased flood risk it may pose.
By utilising Nimbus, property developers can pre-empt these concerns by assessing the risk of flooding before committing to a site. Nimbus provides valuable insights by highlighting flood zones 2 or 3, where a flood risk assessment is likely to be needed to support any planning application. With this information, property developers can make informed decisions and confidently move forward with developing sustainable, low-risk properties.
Settlement Boundaries
Settlement boundaries indicate where new housing developments are feasible and highlight locations that are more favourable for development. Essentially, Settlement boundaries reflect the council's preferred areas for increasing the housing supply making it more likely to obtain planning approval.
It is crucial for developers to plan ahead and consider infrastructure such as roads and utilities that significantly impact the success of their project.
Settlement boundaries are typically well-equipped with the necessary infrastructure to support residents, including amenities such as pubs, shops, public transport, and schools. While it may still be possible to build new homes in areas lacking infrastructure, developers may need to finance such infrastructure themselves if the council doesn't provide funding.
By utilising the settlement boundary planning layer in Nimbus, developers can explore sites with a higher potential for obtaining planning permission. They can construct the appropriate type of housing in the ideal location, reducing the need for extensive infrastructure development later on.
Surface Water Flooding
Whilst surface water flooding is something that can be monitored and reduced, it’s essential to bear in mind that one-in-six properties across the UK are still at significant risk of flooding. According to a report prepared for Defra, repairing a property after a flood can cost anywhere between £10,000 and £50,000, depending on the flood depth.
Whether you're a developer or investor, being aware of potential hidden risks can be the difference between making a profit or a loss on a project. Knowing the degree of risk to flooding, even surface water flooding, before acquiring a property or site can ensure the proper infrastructure is put in place to slow down the flow of water whilst factoring it into the overall development costs.
Nutrient Neutrality Affected LPAs
Property and land developers in the UK have an obligation to ensure that new developments do not increase nutrient pollution in watercourses. This can limit the delivery of new housing, so it is essential for developers to engage with LPAs as soon as possible.
Incorporating measures to reduce nutrient pollution, such as green infrastructure and sustainable drainage systems (SuDS), can increase the likelihood of obtaining planning permission. Nimbus helps land and property developers to identify LPAs affected by nutrient neutrality and plan accordingly to reduce financial losses due to delays.
Conservation Areas
Navigating conservation areas can be a complex task when it comes to planning new developments or investing in existing buildings, as their boundaries are not always clearly defined. There are often strict regulations regarding the appearance of buildings and the possibility of extensions. Additionally, it is worth noting that properties located in these areas may command a higher price due to their protected status as areas of outstanding natural or architectural beauty.
To help simplify the process, Nimbus can provide a clear visual representation of conservation area boundaries on a map, allowing you to easily identify which streets fall within these zones and understand the associated restrictions.
Article 4
Nimbus provides valuable assistance to professional property developers looking to pinpoint areas where Article 4 is in effect across the UK.
Ordinarily, developers enjoy permitted development rights to convert residential properties (C3/ Dwelling House) to HMOs (C4/ House in Multiple Occupation consisting of 6 people or fewer) without needing planning permission from the Council. However, if an Article 4 Direction is implemented, these rights are withdrawn, and planning permission must be sought before any development can proceed.
Local authorities typically use an Article 4 direction to restrict the prolific use of permitted development rights. Whilst most authorities accept that HMOs play an essential role in providing low-cost housing, particularly for young people, they want to ensure that HMOs are more evenly dispersed throughout an area.
For developers intending to utilise permitted development rights, it is essential to be aware of the presence of Article 4 directions, and Nimbus can assist with identifying these areas.
Greenbelt
Obtaining planning permission in greenbelt areas can be a daunting task, as both local residents and councils tend to strongly oppose any new developments. As such, property professionals would greatly benefit from being able to quickly identify these areas before initiating any planning activities.
Fortunately, Nimbus provides a visual solution by precisely identifying the Greenbelt areas on a map, enabling users to clearly visualise the defined boundaries of any national greenbelt land. This helps to prevent any potential issues from arising in the future.
Areas of Natural Beauty AONB
It is crucial for property and land developers in the UK to be familiar with the boundaries of Areas of Natural Beauty (AONB), as these are landscapes with high levels of protection due to their natural beauty, wildlife, and cultural heritage. To ensure the preservation of AONBs, strict planning regulations are in place, and developers must comply with them when planning and carrying out developments in these areas. Non-compliance can result in legal action and hefty fines.
Nimbus helps by identifying AONB boundaries so developers can plan around restrictions or adopt a more sustainable approach to development that respects the natural beauty and importance of the protected area. This can help foster positive relationships with local communities and authorities and lead to a more long-term and sustainable development strategy.
Sites of Special Scientific Interest
While Sites of Special Scientific Interest (SSSIs) are designated as protected areas due to their high conservation value, it is still possible to carry out certain types of development within them through Permitted Development rights.
However, it's important to note that even if development is allowed under Permitted Development rights, it must still comply with certain regulations and restrictions to ensure that the conservation value of the SSSI is not compromised. For example, development must not damage or disturb any important habitats or species, and it must not negatively impact the overall ecological health of the SSSI.
Nimbus helps developers to identify these areas and assess if a project is viable, but ultimately, the conservation of SSSIs is the responsibility of the relevant government bodies, such as Natural England in England, and they have the power to enforce restrictions or revoke Permitted Development rights if necessary to protect the conservation value of the site.
Special Protection Areas
Special Protection Areas (SPAs) are designated areas that provide essential habitats for wild birds and are subject to strict conservation regulations. Identifying SPAs is crucial for developers because it enables them to assess the potential impact of their proposed projects on the surrounding environment and plan accordingly.
By using Nimbus, developers can quickly and easily identify SPAs in their proposed development areas, enabling them to make informed decisions and avoid any negative impacts on the protected habitats. This not only helps to ensure compliance with environmental regulations but also reduces the risk of costly delays and potential legal challenges.
London PTALs
Nimbus helps London developers identify the Public Transport Accessibility Level (PTAL) of potential development sites. The PTAL score ultimately indicates the quality of public transportation in an area and is crucial for evaluating site viability and informing decisions about property or land use.
Higher PTAL scores increase site desirability and value, and can inform decisions about appropriate property types or the existing infrastructure. Nimbus helps developers make informed decisions about potential sites based on accessibility and desirability.
National Parks
National parks are areas of natural beauty that are protected by law, and their boundaries are carefully defined. By using Nimbus, developers can easily see where the national park boundaries are and make informed decisions about where to build. The tool displays the boundaries in a clear and easy-to-understand way, making it simple for developers to identify areas where they need to be cautious.
This helps ensure that developers are able to comply with environmental regulations and avoid any legal issues that could arise from building in protected areas.
Listed Buildings
Listed Buildings are buildings that have been designated as being of special architectural or historic interest and are protected by law. They are listed on the National Heritage List for England (NHLE) and are subject to strict regulations regarding their alteration or demolition.
Identifying Listed Buildings is crucial for property developers as it allows them to understand the potential limitations on what they can do with a site. For example, any proposed alterations to a Listed Building must be approved by the local planning authority and may be subject to specific conditions. This can impact the design and cost of any proposed development.
Nimbus identifies Listed Buildings for developers quickly and easily, allowing them to assess the potential of a site for development and to understand any potential constraints or limitations that may impact their plans. This can save time and money and help to ensure that any proposed development is compliant with relevant regulations and guidelines.
Residential Comparables
Residential property professionals can leverage residential comparable data and tools in Nimbus to efficiently and accurately assess the value of potential sites in the property market. Comparable properties, or "comps," are properties that share similarities in size, location, and condition to the property under evaluation. By analysing sales data of comparable properties in a specific area, developers can determine trends in pricing and demand, identify potential opportunities, and make informed decisions about buying, holding, or selling properties.
Residential property comparables provide critical information about the local property market, helping developers and investors make data-driven decisions. This information can also help them position their properties strategically in the market. By comparing the sales data of similar properties, professionals can identify potential risks or challenges associated with a property, such as market issues or underlying property problems.
Utilising residential property comparables is an essential and powerful tool for professionals in the residential property market. With Nimbus, residential property professionals can access accurate and speedy comparable data and tools to assess current and potential sites, gain valuable market insights, and make informed decisions.
Commercial Comparables
Commercial property professionals can use comparable data and tools in Nimbus to assess their current and potential sites accurately and quickly. Comparable data, also known as "comps," are crucial for developers and investors seeking to evaluate and locate opportunities in the commercial market. Comps refer to properties that have similar size, location, and condition to the one being evaluated, and they aid investors in making informed decisions regarding purchasing, holding, or selling commercial properties.
Using the commercial comparables tools in Nimbus has several advantages, including enabling investors and developers to understand local market dynamics by analysing sales data of comparable properties in the area. This approach enables them to identify pricing and demand trends, potential opportunities, and determine how to position their properties in the market. Commercial comparables allow investors to estimate a property's potential value based on its location, condition, and other factors, which is especially useful when evaluating potential investment properties to determine if they are fairly priced and offer a good return on investment.
Commercial comparables can also aid investors and developers in identifying potential risks or challenges associated with a particular property. For example, if a comparable property sold for significantly less than expected, it may indicate issues with the property that require attention before being sold or developed.
Commercial Availability
With Nimbus' Commercial Availability overlay feature, searching for available commercial properties has never been easier. This unique feature allows you to filter your search by specific property types, such as office, retail, industrial, and leisure and displays all available commercial buildings currently for sale or lease.
Unlike any other property portal, Nimbus gives you a whole market view of the commercial properties available, pinpointed to their exact location on the map and with a link to connect you with the agent listing the property. You can even view images of the property and its full address on the platform and create a list of desirable properties in your workflow that you can export to Excel for a personalised project overview.
Say goodbye to the hassle of scouting for available sites, and say hello to the convenience of Nimbus.
Average Residential Value (psf)
The Average Residential Value (psf) tool provides a wealth of valuable insights. With this tool, you can quickly and easily access an average of the price per square foot (psf) for houses sold in your desired area. This feature is colour-coded from the least expensive to the most expensive, making it easy to identify the most desirable areas for residential development or investment.
But that's not all - our Average Residential Value (psf) tool also provides you with critical information on the average value of the last 12 months and the 12 months prior. This feature is particularly useful for residential developers and investors who need to stay on top of market trends and make informed decisions about where to invest their resources.
Residential Growth Value
Our innovative Residential Growth Value feature is designed to provide you with exciting insights into the growth rate (as a percentage) of average residential sales values in your desired neighbourhoods.
With the residential growth value, you can easily compare the last 12 months with the 12 months prior to identify areas that are experiencing the most significant growth. Our tool is based on the latest census data and offers in-depth neighbourhood-level analysis that is perfect for developers, investors, and real estate professionals
Residential Yield
Nimbus' Residential Yield feature offers insightful data on the average return on investment in a given postcode, aiding investors in maximising their returns and making informed decisions about resource allocation. By simply clicking on a desired area, users can access a comprehensive analysis of figures in an area of interest, detailing the average return on investment for both flats and houses with a breakdown of the number of rooms to make an accurate comparison and assessment.
Deprived Area Index
Nimbus provides property professionals with a powerful tool called the Deprived Area Index, which combines various factors such as affluence, crime rates, and access to green spaces to create a comprehensive rating of neighbourhoods. The index is presented in an intuitive, colour-coded overlay that enables users to quickly and easily identify the most deprived areas within a given region or city.
Despite the potential controversy surrounding the terminology, the index is directly sourced from the government and offers valuable insights for developers and investors looking to invest in a new area. The index provides a ranking from 1-10 for each area, allowing property professionals to assess the saleability of new properties and the level of regeneration needed. With this information, Nimbus empowers property professionals to make more informed decisions about where to invest and how to manage their properties.
HMOs
Typically, if you are a residential property developer interested in HMOs, you may encounter challenges when trying to obtain a comprehensive list of all registered HMOs in your area or nationwide. One of the common approaches is to contact the HMO officer at the local council to request the list. However, this process can be tedious and time-consuming, and may not provide you with adequate information about the local HMO density and demand.
Fortunately, Nimbus offers a more efficient solution to this challenge. With Nimbus, you can easily access an interactive overlay that shows you all registered HMOs nationally, as well as their detailed license information, including the date each license was issued and the number of occupants in each property. This feature is particularly useful for property developers who need to understand the HMO market and make informed investment decisions for their own portfolios.
Vacant Buildings
This cutting-edge tool allows commercial property professionals to easily pinpoint unoccupied buildings throughout England and Wales. The buildings are categorised by a visual colour coding: Green indicates a vacancy lasting longer than 6 months, while Amber indicates a more recent vacancy within the past 6 months.
Moreover, each building displayed on the map features its own information panel, providing in-depth details such as the title number, address, property usage, and even the date of when it became vacant.
Traffic Pins
Nimbus offers a powerful technical overlay that provides valuable insights into daily traffic movements, enabling property professionals to make informed decisions about potential new developments in the area. The overlay provides detailed data on traffic density, helping professionals assess the impact of new developments on local roadways and identify potential concerns. In addition, the overlay can highlight sites with high traffic counts above 18,000, making it an invaluable tool for roadside and fast-food operators looking to identify potential locations for their business.
By leveraging the power of Nimbus's advanced analytics, property professionals can gain a deeper understanding of traffic patterns and make more informed decisions about future developments.
Traffic Volume Heatmap
As a commercial property professional (developer investor, occupier or surveyor), finding the right location is key to the success of your business. That's why Nimbus offers a powerful Traffic Volume Heatmap that provides you with a detailed view of daily traffic movements at specific points on every major and minor road. Unlike other solutions that rely on outdated pin data, our heatmap is updated monthly with data from recent sources, including mobile data, providing you with the most accurate and up-to-date view of traffic movements.
In addition to covering roads that have nearby data points, our heatmap also includes roads that don't, giving you a more comprehensive view of traffic flow across your entire target area. With this information, you can assess traffic volumes and patterns, gaining an accurate picture of how busy a road is throughout the day. This data is invaluable in identifying potential hotspots for your business, allowing you to maximise footfall and overall visibility.
HS2 Route
Nimbus offers a powerful HS2 Route overlay that displays the proposed route of the High Speed 2 railway line, a major infrastructure project in the UK. This feature is particularly useful for property professionals who need to assess the potential impact of the HS2 project on existing or proposed developments in the surrounding areas.
By overlaying the HS2 route on your property map, you can gain a deeper understanding of how the project may impact your developments. This information can help you make more informed decisions about where to invest your time and resources, ensuring that your projects are in line with the long-term plans for the region.
Coal Mining Reporting Areas and High-Risk Areas
Nimbus can help you assess the risk of subsidence on your property development project with its powerful overlays showing Coal Mining Reporting Areas (CMRAs) and High-Risk Areas (HRAs). By simply overlaying these areas on your property map, you can quickly understand any potential risks related to historic coal mining activity that may affect your project.
This information is crucial for making informed decisions about where to invest your time and resources, ensuring that your development is located in a safe and secure area with the lowest possible risk of subsidence. With Nimbus, you can access all the information you need about CMRAs and HRAs in one place, without needing to spend hours doing manual research or data gathering. Our platform provides a clear and easy-to-understand view of the potential risks associated with a site, helping you make the best decisions for your next property development project.
Agricultural Land Classification – England and Wales
This feature provides an overlay that shows the quality of land for agricultural use in England and Wales. The overlay can help property professionals assess the potential of land for agricultural use and can aid in determining the suitability of a site for a particular type of development.
Radon Map
Nimbus displays a technical overlay that shows the radon risk in a particular area. Radon is a naturally occurring radioactive gas that can accumulate in buildings, and high levels of radon can pose a risk to human health. This information can be particularly useful for property professionals who are assessing the potential risk of radon for new developments.
Substations
This feature provides an overlay that shows the location of DNO (Distribution Network Operator) substations, including information on their RAG (Risk Assessment Guidance) status, capacity (headroom), and ownership. This information can be particularly useful for property professionals who are looking for investment opportunities in the renewable energy sector, as it can help identify potential sites for new wind or solar energy projects.
Commercial to residential (Exclusive to Elite+)
The Class MA introduction into PD rights means more investors and developers can take advantage of vacant commercial buildings for conversion to residential use.
As a Nimbus user, you will now have the added opportunity to take advantage of the ‘commercial to residential overlay’. The unique tool displays properties that are potentially suitable for redevelopment and even estimates their potential profit.
Airspace above flats (Exclusive to Elite+)
Since the changes to general permitted development rights in England, investors and developers can add new floors to existing buildings without planning. This applies to buildings under Class A, AA & AB permitted development rights, where the buildings are not controlled by the residents.
Never has there been a platform that can identify profitable opportunities on pre-existing buildings and even estimate the total value of the opportunity.
Nimbus Maps can provide detailed building plots with the square footage and roof space value by title number.
Airspace above houses (Exclusive to Elite+)
Ever looked at a residential building in the street, dwarfed by other houses and realised that would be an opportunity to add another floor? Well, now you can with Nimbus Maps.
Finding profitable opportunities on pre-existing buildings with Nimbus Maps is so easy. The platform will scan the whole of London to find properties that could be extended upwards and even estimate the profitability of doing so!
Shops with uppers (Exclusive to Elite+)
Most high streets have retail units in buildings comprising of multiple units. If it is not immediately obvious that those properties have residential apartments above, most of us would just assume it is used as storage rooms for the business below.
This can create an opportunity for the investor with a ‘sky is the limit’ mantra. Those stories above retail spaces on the ground floor can be redeveloped into town centre apartments under Class G permitted development rights. In buying the building you can enjoy two streams of income, firstly from the business below and secondly by converting the space above into apartments.
Nimbus Maps has the intelligent ability to find those retail properties that have stories above under commercial usage that would present an ideal opportunity to convert. The platform will present the individual titles and even give you an estimate of potential profitability. Once again taking the hard work out of site finding.
Unbroken Blocks of Flats (Exclusive to Elite+)
’The term ‘multi-unit block of flats’ and ‘unbroken block of flats’ are really one and the same - it’s a property split into different self-contained flats. However, in the case of unbroken blocks of flats, instead of having individual leaseholds the property can be owned entirely and held under a single freehold title without having any of the individual flats sold off prior to purchase.
Unbroken blocks of flats tend to be difficult to find, as you can’t tell from looking at the outside of a building whether the individual properties are sold or being rented out. Property investors currently have to follow the over-complicated process of identifying the address and title number of a potential freehold block, identifying who owns the title, and then identifying whether any leases are in place for the individual flats.
Using proprietary datasets and algorithms, we have created a straightforward filter to highlight every unbroken block of flats in England and Wales on the map. Users can browse all the relevant information on the property, including ownership information, allowing them to select the best blocks and connect effortlessly with the owners of those blocks to secure them off-market, at a reasonable price.
Nimbus can also show you local residential yields, which areas are growing in residential value, and what the planning permission history of the block has been. This can make it very easy to assess the value of each unbroken block right from your desk.
Low-value commercial in residential areas (Exclusive to Elite+)
Independent retailers over the last decade have taken a real hit and evidence of this is littered around our communities. Vacant retail units and closing-down signs have become the norm. As sad as this may sound the government has thrown property developers a lifeline under the new Class MA permitted development rights (see Nimbus webinars and blogs for more info on Class MA).
Most property investors like to start small and build their empires from humble beginnings. This change to PD rights will be no different. Starting with small commercial units and scaling the business as experience grows.
Nimbus Maps has an exciting tool to meet this opportunity in commercial buildings and is great for developers with smaller budgets. The strategy overlay will feature low-value commercial properties in residential areas which should be financially viable to convert to residential use. This is a gateway for developers looking to take advantage of Class MA.
Development plots (Exclusive to Elite+)
The easiest way to develop a property is to take a large plot with a pre-existing residential property and knock it down to fit more modern dwellings on the site. Easier in the sense that the utilities have been connected to the plot at some point and because it was previously a residential home, the planning application should be far more favourable with the local authority.
The development plots strategy with Nimbus Maps shows properties based on site acreage and the site density so you can quickly assess if this is viable for redevelopment. You can now search for building plots with this tool to accelerate how you filter out unviable plots. Instantly find suitable land today with Nimbus Maps.
Residential to HMO (Exclusive to Elite+)
Finding a buy-to-let investment with yields of 14% was virtually unheard of a couple of decades ago but houses of multiple occupancy (HMOs) have taken off in recent years. They seem to be a right of passage for any property entrepreneur taking their next step in building a portfolio.
Finding a property right for HMO conversion has always been one of the major stumbling blocks for most investors. The introduction of Article 4 into some local authority jurisdictions can mean that some properties are just not viable.
The residential to HMO overlay strategy analyses the country to find properties in areas where HMOs make up less than 10% within a 50m radius. It will also identify if the area you are searching is covered by Article 4 meaning your search gives you all the specific information for HMO investment.
HMOs with potential (Exclusive to Elite+)
HMOs or Houses of multiple occupations are a popular investment for property entrepreneurs. Some areas have already used up all the available properties suitable for HMO conversion, especially in densely populated areas. However, demand is still rampant as rental values increase and the current HMOs are not being utilised to their full capacity on plots with potential expansion.
Nimbus Maps has the functionality to show you HMO properties that can Increase profitability in high-demand areas. The platform will highlight already registered HMOs on plot maps with their site density to indicate how much of the total land is being utilised and the capacity of persons currently in the property. The map is uniquely colour-coded to give a clear average of site density on that street.
Finding utilised HMOs has never been so obvious.
Expiring residential leases (Exclusive to Elite+)
This is a popular strategy for developers. This tool gives up-to-date data on buildings' lease length and categorises them during a search into remaining years.
Most mortgage lenders will find properties with leases under 75 years remaining very unlikely to finance. This means the properties drop significantly below market value (BMV) and can be bought by investors who have the resources to renegotiate a lease extension.
This can turn a sizable profit for investors especially if the properties themselves need updating.
Expiring commercial leases (Exclusive to Elite+)
Expiring commercial leases are a fantastic opportunity to instantly identify active commercial sellers and properties with expiring leases. This tool gives up-to-date data on buildings' lease length and categorises them during a search into remaining years.
The commercial leases that are expiring are colour coded so you can target the properties nearing the end of their lease agreement. Full details are also given of the tenant, size, business rates and rates per square foot.
Planning Applications
Nimbus provides a comprehensive solution for property developers and investors to evaluate investment opportunities. This specific innovative tool allows users to access planning applications overlaid on a map in their desired area, providing all relevant information such as:
- Application Type (Residential, Commercial, Both/ Conversion)
- Application Size
- Application Age
The data is colour-coded and pinpointed to provide a visual assessment of planning density and the likelihood of approval for new applications. The planning application feature is dynamic and user-friendly, offering the ability to display individual planning applications by reference number and status, and to link directly to the local authority's website for more details.
Overall, it is an essential tool for property developers and investors looking to evaluate investment opportunities, assess planning density, and make informed decisions.
Council Boundaries
It is essential for property developers and investors to know council boundaries in the UK because each council has different planning policies, regulations, and priorities. These policies and regulations can greatly impact the development process and the likelihood of obtaining planning permission for a property.
Nimbus shows precise local authority jurisdiction borders so users can tailor their development plans and strategies to fit within the specific policies and regulations of the council in which the property is located. This can increase the chances of obtaining planning permission, identify potential opportunities and risks within specific areas, and help avoid costly delays and rejections.
Nimbus also provides the full contact details including email, website and link to the local plan. This information can be used to help you connect quicker with a specific council, make informed investment decisions and ultimately maximise returns on investment.
Brownfield Land Register
Brownfield sites are important for property developers in the UK as they can offer cost-effective opportunities in desirable locations, provide environmental benefits, and support regeneration and economic growth.
Nimbus helps developers identify potential development opportunities and access information about the suitability of specific sites ripe for development. This can save time and resources, and help developers prioritise their efforts and investments.
SHLAA Sites
Accessing SHLAA information helps developers to identify which sites have the potential for residential development. With our innovative overlay, residential property developers can quickly locate areas that have been earmarked as part of SHLAA. This enables them to efficiently evaluate the sites before moving forward.
Typically, these sites will have been assessed to identify the most viable options for development, making them more likely to receive planning permission. The identification of SHLAA sites also suggests that the landowner is open to the potential of selling the property.
What would typically require days of research and sifting through irrelevant information can now be accomplished in seconds, thanks to our comprehensive project pipeline within Nimbus. More information on our SHLAA overlay and how developers can leverage this feature can be found here.
Housing Delivery Test
Each year, the Government issues a report displaying the proportion of homes constructed in comparison to the number of homes required, along with the local authorities accountable for fulfilling these objectives.
If you're seeking information on demand in particular regions, the report is a comprehensive resource. Additionally, similar to the councils' overlay, Nimbus applies a colour code to each local authority region based on their progress in achieving their housing delivery goals.
This is particularly advantageous for individuals interested in investing in areas where there is a high demand for new residential housing and where the councils would appreciate their contribution.
In short, the Housing Delivery Test overlay within Nimbus serves as a link between developers and local authorities to help address the housing crisis.
Flood Map
It's essential to have a thorough understanding of potential flood risks when assessing potential sites for new developments. Not only does this help determine the sustainability of the development in relation to flood risk, but it also helps you understand the potential impact your development may have on the environment and the increased flood risk it may pose.
By utilising Nimbus, property developers can pre-empt these concerns by assessing the risk of flooding before committing to a site. Nimbus provides valuable insights by highlighting flood zones 2 or 3, where a flood risk assessment is likely to be needed to support any planning application. With this information, property developers can make informed decisions and confidently move forward with developing sustainable, low-risk properties.
Settlement Boundaries
Settlement boundaries indicate where new housing developments are feasible and highlight locations that are more favourable for development. Essentially, Settlement boundaries reflect the council's preferred areas for increasing the housing supply making it more likely to obtain planning approval.
It is crucial for developers to plan ahead and consider infrastructure such as roads and utilities that significantly impact the success of their project.
Settlement boundaries are typically well-equipped with the necessary infrastructure to support residents, including amenities such as pubs, shops, public transport, and schools. While it may still be possible to build new homes in areas lacking infrastructure, developers may need to finance such infrastructure themselves if the council doesn't provide funding.
By utilising the settlement boundary planning layer in Nimbus, developers can explore sites with a higher potential for obtaining planning permission. They can construct the appropriate type of housing in the ideal location, reducing the need for extensive infrastructure development later on.
Surface Water Flooding
Whilst surface water flooding is something that can be monitored and reduced, it’s essential to bear in mind that one-in-six properties across the UK are still at significant risk of flooding. According to a report prepared for Defra, repairing a property after a flood can cost anywhere between £10,000 and £50,000, depending on the flood depth.
Whether you're a developer or investor, being aware of potential hidden risks can be the difference between making a profit or a loss on a project. Knowing the degree of risk to flooding, even surface water flooding, before acquiring a property or site can ensure the proper infrastructure is put in place to slow down the flow of water whilst factoring it into the overall development costs.
Nutrient Neutrality Affected LPAs
Property and land developers in the UK have an obligation to ensure that new developments do not increase nutrient pollution in watercourses. This can limit the delivery of new housing, so it is essential for developers to engage with LPAs as soon as possible.
Incorporating measures to reduce nutrient pollution, such as green infrastructure and sustainable drainage systems (SuDS), can increase the likelihood of obtaining planning permission. Nimbus helps land and property developers to identify LPAs affected by nutrient neutrality and plan accordingly to reduce financial losses due to delays.
Conservation Areas
Navigating conservation areas can be a complex task when it comes to planning new developments or investing in existing buildings, as their boundaries are not always clearly defined. There are often strict regulations regarding the appearance of buildings and the possibility of extensions. Additionally, it is worth noting that properties located in these areas may command a higher price due to their protected status as areas of outstanding natural or architectural beauty.
To help simplify the process, Nimbus can provide a clear visual representation of conservation area boundaries on a map, allowing you to easily identify which streets fall within these zones and understand the associated restrictions.
Article 4
Nimbus provides valuable assistance to professional property developers looking to pinpoint areas where Article 4 is in effect across the UK.
Ordinarily, developers enjoy permitted development rights to convert residential properties (C3/ Dwelling House) to HMOs (C4/ House in Multiple Occupation consisting of 6 people or fewer) without needing planning permission from the Council. However, if an Article 4 Direction is implemented, these rights are withdrawn, and planning permission must be sought before any development can proceed.
Local authorities typically use an Article 4 direction to restrict the prolific use of permitted development rights. Whilst most authorities accept that HMOs play an essential role in providing low-cost housing, particularly for young people, they want to ensure that HMOs are more evenly dispersed throughout an area.
For developers intending to utilise permitted development rights, it is essential to be aware of the presence of Article 4 directions, and Nimbus can assist with identifying these areas.
Greenbelt
Obtaining planning permission in greenbelt areas can be a daunting task, as both local residents and councils tend to strongly oppose any new developments. As such, property professionals would greatly benefit from being able to quickly identify these areas before initiating any planning activities.
Fortunately, Nimbus provides a visual solution by precisely identifying the Greenbelt areas on a map, enabling users to clearly visualise the defined boundaries of any national greenbelt land. This helps to prevent any potential issues from arising in the future.
Areas of Natural Beauty AONB
It is crucial for property and land developers in the UK to be familiar with the boundaries of Areas of Natural Beauty (AONB), as these are landscapes with high levels of protection due to their natural beauty, wildlife, and cultural heritage. To ensure the preservation of AONBs, strict planning regulations are in place, and developers must comply with them when planning and carrying out developments in these areas. Non-compliance can result in legal action and hefty fines.
Nimbus helps by identifying AONB boundaries so developers can plan around restrictions or adopt a more sustainable approach to development that respects the natural beauty and importance of the protected area. This can help foster positive relationships with local communities and authorities and lead to a more long-term and sustainable development strategy.
Sites of Special Scientific Interest
While Sites of Special Scientific Interest (SSSIs) are designated as protected areas due to their high conservation value, it is still possible to carry out certain types of development within them through Permitted Development rights.
However, it's important to note that even if development is allowed under Permitted Development rights, it must still comply with certain regulations and restrictions to ensure that the conservation value of the SSSI is not compromised. For example, development must not damage or disturb any important habitats or species, and it must not negatively impact the overall ecological health of the SSSI.
Nimbus helps developers to identify these areas and assess if a project is viable, but ultimately, the conservation of SSSIs is the responsibility of the relevant government bodies, such as Natural England in England, and they have the power to enforce restrictions or revoke Permitted Development rights if necessary to protect the conservation value of the site.
Special Protection Areas
Special Protection Areas (SPAs) are designated areas that provide essential habitats for wild birds and are subject to strict conservation regulations. Identifying SPAs is crucial for developers because it enables them to assess the potential impact of their proposed projects on the surrounding environment and plan accordingly.
By using Nimbus, developers can quickly and easily identify SPAs in their proposed development areas, enabling them to make informed decisions and avoid any negative impacts on the protected habitats. This not only helps to ensure compliance with environmental regulations but also reduces the risk of costly delays and potential legal challenges.
London PTALs
Nimbus helps London developers identify the Public Transport Accessibility Level (PTAL) of potential development sites. The PTAL score ultimately indicates the quality of public transportation in an area and is crucial for evaluating site viability and informing decisions about property or land use.
Higher PTAL scores increase site desirability and value, and can inform decisions about appropriate property types or the existing infrastructure. Nimbus helps developers make informed decisions about potential sites based on accessibility and desirability.
National Parks
National parks are areas of natural beauty that are protected by law, and their boundaries are carefully defined. By using Nimbus, developers can easily see where the national park boundaries are and make informed decisions about where to build. The tool displays the boundaries in a clear and easy-to-understand way, making it simple for developers to identify areas where they need to be cautious.
This helps ensure that developers are able to comply with environmental regulations and avoid any legal issues that could arise from building in protected areas.
Listed Buildings
Listed Buildings are buildings that have been designated as being of special architectural or historic interest and are protected by law. They are listed on the National Heritage List for England (NHLE) and are subject to strict regulations regarding their alteration or demolition.
Identifying Listed Buildings is crucial for property developers as it allows them to understand the potential limitations on what they can do with a site. For example, any proposed alterations to a Listed Building must be approved by the local planning authority and may be subject to specific conditions. This can impact the design and cost of any proposed development.
Nimbus identifies Listed Buildings for developers quickly and easily, allowing them to assess the potential of a site for development and to understand any potential constraints or limitations that may impact their plans. This can save time and money and help to ensure that any proposed development is compliant with relevant regulations and guidelines.
Residential Comparables
Residential property professionals can leverage residential comparable data and tools in Nimbus to efficiently and accurately assess the value of potential sites in the property market. Comparable properties, or "comps," are properties that share similarities in size, location, and condition to the property under evaluation. By analysing sales data of comparable properties in a specific area, developers can determine trends in pricing and demand, identify potential opportunities, and make informed decisions about buying, holding, or selling properties.
Residential property comparables provide critical information about the local property market, helping developers and investors make data-driven decisions. This information can also help them position their properties strategically in the market. By comparing the sales data of similar properties, professionals can identify potential risks or challenges associated with a property, such as market issues or underlying property problems.
Utilising residential property comparables is an essential and powerful tool for professionals in the residential property market. With Nimbus, residential property professionals can access accurate and speedy comparable data and tools to assess current and potential sites, gain valuable market insights, and make informed decisions.
Commercial Comparables
Commercial property professionals can use comparable data and tools in Nimbus to assess their current and potential sites accurately and quickly. Comparable data, also known as "comps," are crucial for developers and investors seeking to evaluate and locate opportunities in the commercial market. Comps refer to properties that have similar size, location, and condition to the one being evaluated, and they aid investors in making informed decisions regarding purchasing, holding, or selling commercial properties.
Using the commercial comparables tools in Nimbus has several advantages, including enabling investors and developers to understand local market dynamics by analysing sales data of comparable properties in the area. This approach enables them to identify pricing and demand trends, potential opportunities, and determine how to position their properties in the market. Commercial comparables allow investors to estimate a property's potential value based on its location, condition, and other factors, which is especially useful when evaluating potential investment properties to determine if they are fairly priced and offer a good return on investment.
Commercial comparables can also aid investors and developers in identifying potential risks or challenges associated with a particular property. For example, if a comparable property sold for significantly less than expected, it may indicate issues with the property that require attention before being sold or developed.
Commercial Availability
With Nimbus' Commercial Availability overlay feature, searching for available commercial properties has never been easier. This unique feature allows you to filter your search by specific property types, such as office, retail, industrial, and leisure and displays all available commercial buildings currently for sale or lease.
Unlike any other property portal, Nimbus gives you a whole market view of the commercial properties available, pinpointed to their exact location on the map and with a link to connect you with the agent listing the property. You can even view images of the property and its full address on the platform and create a list of desirable properties in your workflow that you can export to Excel for a personalised project overview.
Say goodbye to the hassle of scouting for available sites, and say hello to the convenience of Nimbus.
Average Residential Value (psf)
The Average Residential Value (psf) tool provides a wealth of valuable insights. With this tool, you can quickly and easily access an average of the price per square foot (psf) for houses sold in your desired area. This feature is colour-coded from the least expensive to the most expensive, making it easy to identify the most desirable areas for residential development or investment.
But that's not all - our Average Residential Value (psf) tool also provides you with critical information on the average value of the last 12 months and the 12 months prior. This feature is particularly useful for residential developers and investors who need to stay on top of market trends and make informed decisions about where to invest their resources.
Residential Growth Value
Our innovative Residential Growth Value feature is designed to provide you with exciting insights into the growth rate (as a percentage) of average residential sales values in your desired neighbourhoods.
With the residential growth value, you can easily compare the last 12 months with the 12 months prior to identify areas that are experiencing the most significant growth. Our tool is based on the latest census data and offers in-depth neighbourhood-level analysis that is perfect for developers, investors, and real estate professionals
Residential Yield
Nimbus' Residential Yield feature offers insightful data on the average return on investment in a given postcode, aiding investors in maximising their returns and making informed decisions about resource allocation. By simply clicking on a desired area, users can access a comprehensive analysis of figures in an area of interest, detailing the average return on investment for both flats and houses with a breakdown of the number of rooms to make an accurate comparison and assessment.
Deprived Area Index
Nimbus provides property professionals with a powerful tool called the Deprived Area Index, which combines various factors such as affluence, crime rates, and access to green spaces to create a comprehensive rating of neighbourhoods. The index is presented in an intuitive, colour-coded overlay that enables users to quickly and easily identify the most deprived areas within a given region or city.
Despite the potential controversy surrounding the terminology, the index is directly sourced from the government and offers valuable insights for developers and investors looking to invest in a new area. The index provides a ranking from 1-10 for each area, allowing property professionals to assess the saleability of new properties and the level of regeneration needed. With this information, Nimbus empowers property professionals to make more informed decisions about where to invest and how to manage their properties.
HMOs
Typically, if you are a residential property developer interested in HMOs, you may encounter challenges when trying to obtain a comprehensive list of all registered HMOs in your area or nationwide. One of the common approaches is to contact the HMO officer at the local council to request the list. However, this process can be tedious and time-consuming, and may not provide you with adequate information about the local HMO density and demand.
Fortunately, Nimbus offers a more efficient solution to this challenge. With Nimbus, you can easily access an interactive overlay that shows you all registered HMOs nationally, as well as their detailed license information, including the date each license was issued and the number of occupants in each property. This feature is particularly useful for property developers who need to understand the HMO market and make informed investment decisions for their own portfolios.
Vacant Buildings
This cutting-edge tool allows commercial property professionals to easily pinpoint unoccupied buildings throughout England and Wales. The buildings are categorised by a visual colour coding: Green indicates a vacancy lasting longer than 6 months, while Amber indicates a more recent vacancy within the past 6 months.
Moreover, each building displayed on the map features its own information panel, providing in-depth details such as the title number, address, property usage, and even the date of when it became vacant.
Traffic Pins
Nimbus offers a powerful technical overlay that provides valuable insights into daily traffic movements, enabling property professionals to make informed decisions about potential new developments in the area. The overlay provides detailed data on traffic density, helping professionals assess the impact of new developments on local roadways and identify potential concerns. In addition, the overlay can highlight sites with high traffic counts above 18,000, making it an invaluable tool for roadside and fast-food operators looking to identify potential locations for their business.
By leveraging the power of Nimbus's advanced analytics, property professionals can gain a deeper understanding of traffic patterns and make more informed decisions about future developments.
Traffic Volume Heatmap
As a commercial property professional (developer investor, occupier or surveyor), finding the right location is key to the success of your business. That's why Nimbus offers a powerful Traffic Volume Heatmap that provides you with a detailed view of daily traffic movements at specific points on every major and minor road. Unlike other solutions that rely on outdated pin data, our heatmap is updated monthly with data from recent sources, including mobile data, providing you with the most accurate and up-to-date view of traffic movements.
In addition to covering roads that have nearby data points, our heatmap also includes roads that don't, giving you a more comprehensive view of traffic flow across your entire target area. With this information, you can assess traffic volumes and patterns, gaining an accurate picture of how busy a road is throughout the day. This data is invaluable in identifying potential hotspots for your business, allowing you to maximise footfall and overall visibility.
HS2 Route
Nimbus offers a powerful HS2 Route overlay that displays the proposed route of the High Speed 2 railway line, a major infrastructure project in the UK. This feature is particularly useful for property professionals who need to assess the potential impact of the HS2 project on existing or proposed developments in the surrounding areas.
By overlaying the HS2 route on your property map, you can gain a deeper understanding of how the project may impact your developments. This information can help you make more informed decisions about where to invest your time and resources, ensuring that your projects are in line with the long-term plans for the region.
Coal Mining Reporting Areas and High-Risk Areas
Nimbus can help you assess the risk of subsidence on your property development project with its powerful overlays showing Coal Mining Reporting Areas (CMRAs) and High-Risk Areas (HRAs). By simply overlaying these areas on your property map, you can quickly understand any potential risks related to historic coal mining activity that may affect your project.
This information is crucial for making informed decisions about where to invest your time and resources, ensuring that your development is located in a safe and secure area with the lowest possible risk of subsidence. With Nimbus, you can access all the information you need about CMRAs and HRAs in one place, without needing to spend hours doing manual research or data gathering. Our platform provides a clear and easy-to-understand view of the potential risks associated with a site, helping you make the best decisions for your next property development project.
Agricultural Land Classification – England and Wales
This feature provides an overlay that shows the quality of land for agricultural use in England and Wales. The overlay can help property professionals assess the potential of land for agricultural use and can aid in determining the suitability of a site for a particular type of development.
Radon Map
Nimbus displays a technical overlay that shows the radon risk in a particular area. Radon is a naturally occurring radioactive gas that can accumulate in buildings, and high levels of radon can pose a risk to human health. This information can be particularly useful for property professionals who are assessing the potential risk of radon for new developments.
Substations
This feature provides an overlay that shows the location of DNO (Distribution Network Operator) substations, including information on their RAG (Risk Assessment Guidance) status, capacity (headroom), and ownership. This information can be particularly useful for property professionals who are looking for investment opportunities in the renewable energy sector, as it can help identify potential sites for new wind or solar energy projects.
Commercial to residential (Exclusive to Elite+)
The Class MA introduction into PD rights means more investors and developers can take advantage of vacant commercial buildings for conversion to residential use.
As a Nimbus user, you will now have the added opportunity to take advantage of the ‘commercial to residential overlay’. The unique tool displays properties that are potentially suitable for redevelopment and even estimates their potential profit.
Airspace above flats (Exclusive to Elite+)
Since the changes to general permitted development rights in England, investors and developers can add new floors to existing buildings without planning. This applies to buildings under Class A, AA & AB permitted development rights, where the buildings are not controlled by the residents.
Never has there been a platform that can identify profitable opportunities on pre-existing buildings and even estimate the total value of the opportunity.
Nimbus Maps can provide detailed building plots with the square footage and roof space value by title number.
Airspace above houses (Exclusive to Elite+)
Ever looked at a residential building in the street, dwarfed by other houses and realised that would be an opportunity to add another floor? Well, now you can with Nimbus Maps.
Finding profitable opportunities on pre-existing buildings with Nimbus Maps is so easy. The platform will scan the whole of London to find properties that could be extended upwards and even estimate the profitability of doing so!
Shops with uppers (Exclusive to Elite+)
Most high streets have retail units in buildings comprising of multiple units. If it is not immediately obvious that those properties have residential apartments above, most of us would just assume it is used as storage rooms for the business below.
This can create an opportunity for the investor with a ‘sky is the limit’ mantra. Those stories above retail spaces on the ground floor can be redeveloped into town centre apartments under Class G permitted development rights. In buying the building you can enjoy two streams of income, firstly from the business below and secondly by converting the space above into apartments.
Nimbus Maps has the intelligent ability to find those retail properties that have stories above under commercial usage that would present an ideal opportunity to convert. The platform will present the individual titles and even give you an estimate of potential profitability. Once again taking the hard work out of site finding.
Unbroken Blocks of Flats (Exclusive to Elite+)
’The term ‘multi-unit block of flats’ and ‘unbroken block of flats’ are really one and the same - it’s a property split into different self-contained flats. However, in the case of unbroken blocks of flats, instead of having individual leaseholds the property can be owned entirely and held under a single freehold title without having any of the individual flats sold off prior to purchase.
Unbroken blocks of flats tend to be difficult to find, as you can’t tell from looking at the outside of a building whether the individual properties are sold or being rented out. Property investors currently have to follow the over-complicated process of identifying the address and title number of a potential freehold block, identifying who owns the title, and then identifying whether any leases are in place for the individual flats.
Using proprietary datasets and algorithms, we have created a straightforward filter to highlight every unbroken block of flats in England and Wales on the map. Users can browse all the relevant information on the property, including ownership information, allowing them to select the best blocks and connect effortlessly with the owners of those blocks to secure them off-market, at a reasonable price.
Nimbus can also show you local residential yields, which areas are growing in residential value, and what the planning permission history of the block has been. This can make it very easy to assess the value of each unbroken block right from your desk.
Low-value commercial in residential areas (Exclusive to Elite+)
Independent retailers over the last decade have taken a real hit and evidence of this is littered around our communities. Vacant retail units and closing-down signs have become the norm. As sad as this may sound the government has thrown property developers a lifeline under the new Class MA permitted development rights (see Nimbus webinars and blogs for more info on Class MA).
Most property investors like to start small and build their empires from humble beginnings. This change to PD rights will be no different. Starting with small commercial units and scaling the business as experience grows.
Nimbus Maps has an exciting tool to meet this opportunity in commercial buildings and is great for developers with smaller budgets. The strategy overlay will feature low-value commercial properties in residential areas which should be financially viable to convert to residential use. This is a gateway for developers looking to take advantage of Class MA.
Development plots (Exclusive to Elite+)
The easiest way to develop a property is to take a large plot with a pre-existing residential property and knock it down to fit more modern dwellings on the site. Easier in the sense that the utilities have been connected to the plot at some point and because it was previously a residential home, the planning application should be far more favourable with the local authority.
The development plots strategy with Nimbus Maps shows properties based on site acreage and the site density so you can quickly assess if this is viable for redevelopment. You can now search for building plots with this tool to accelerate how you filter out unviable plots. Instantly find suitable land today with Nimbus Maps.
Residential to HMO (Exclusive to Elite+)
Finding a buy-to-let investment with yields of 14% was virtually unheard of a couple of decades ago but houses of multiple occupancy (HMOs) have taken off in recent years. They seem to be a right of passage for any property entrepreneur taking their next step in building a portfolio.
Finding a property right for HMO conversion has always been one of the major stumbling blocks for most investors. The introduction of Article 4 into some local authority jurisdictions can mean that some properties are just not viable.
The residential to HMO overlay strategy analyses the country to find properties in areas where HMOs make up less than 10% within a 50m radius. It will also identify if the area you are searching is covered by Article 4 meaning your search gives you all the specific information for HMO investment.
HMOs with potential (Exclusive to Elite+)
HMOs or Houses of multiple occupations are a popular investment for property entrepreneurs. Some areas have already used up all the available properties suitable for HMO conversion, especially in densely populated areas. However, demand is still rampant as rental values increase and the current HMOs are not being utilised to their full capacity on plots with potential expansion.
Nimbus Maps has the functionality to show you HMO properties that can Increase profitability in high-demand areas. The platform will highlight already registered HMOs on plot maps with their site density to indicate how much of the total land is being utilised and the capacity of persons currently in the property. The map is uniquely colour-coded to give a clear average of site density on that street.
Finding utilised HMOs has never been so obvious.
Expiring residential leases (Exclusive to Elite+)
This is a popular strategy for developers. This tool gives up-to-date data on buildings' lease length and categorises them during a search into remaining years.
Most mortgage lenders will find properties with leases under 75 years remaining very unlikely to finance. This means the properties drop significantly below market value (BMV) and can be bought by investors who have the resources to renegotiate a lease extension.
This can turn a sizable profit for investors especially if the properties themselves need updating.
Expiring commercial leases (Exclusive to Elite+)
Expiring commercial leases are a fantastic opportunity to instantly identify active commercial sellers and properties with expiring leases. This tool gives up-to-date data on buildings' lease length and categorises them during a search into remaining years.
The commercial leases that are expiring are colour coded so you can target the properties nearing the end of their lease agreement. Full details are also given of the tenant, size, business rates and rates per square foot.
